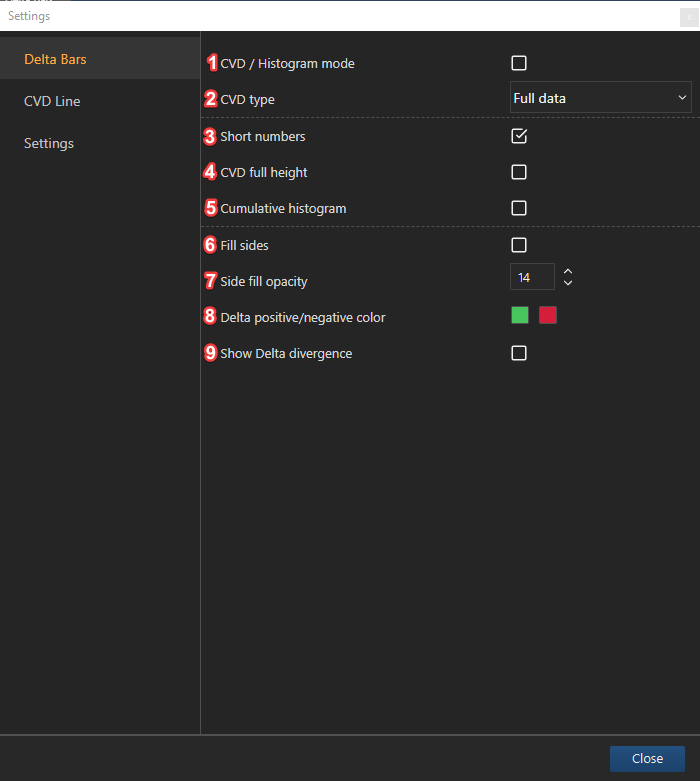
DBars main settings
Delta bars (DBars) display differences between buy and sell volumes in a candle bar view mode. Green colored candles indicates more trades at the Ask price (buy volume), where red colored candles indicates more trades at the bid price (sell volume).

1 - CVD / Histogram mode: display volume delta in the cumulative, or histogram mode. In histogram mode, every candle starts from horizontal axis, candle height represents Buy-Sell delta in respective candle. All the candles placed on the horizontal axis, zero line. Candle direction represents positive, or negative delta. In CVD mode every candle drawn in respective to the previous values in cumulative mode, representing accumulated value by the candle position on the vertical axis;
2 - CVD type: this value is important only in CVD and changes accumulated value calculation period;
Session - accumulation period start form beginning of the session;
Visible range - accumulation period start form visible range beginning on the left of the chart;
Full data - accumulation calculation period starts from beginning of the candle period lookback settings;
3 - Short numbers: Shortens numbers to millions, on the vertical axis of the Delta bars;
4 - CVD full height: vertically distributes (fit to height) CVD from the lowest value at the bottom;
5 - Cumulative histogram: histogram mode Buy-Sell delta values accumulated;
6 - Fill sides: enables background color;
7 - Side fill opacity: changes background color opacity, mini - 1, max- 100;
8 - Delta positive/negative color: changes candle color, for the positive and negative values;
9 - Show Delta divergence: displays divergence of the delta (Buy-Sell) candle and chart (Open-Close) candle. In case of divergence delta candle background colored as vertical line in respective chart candle color.