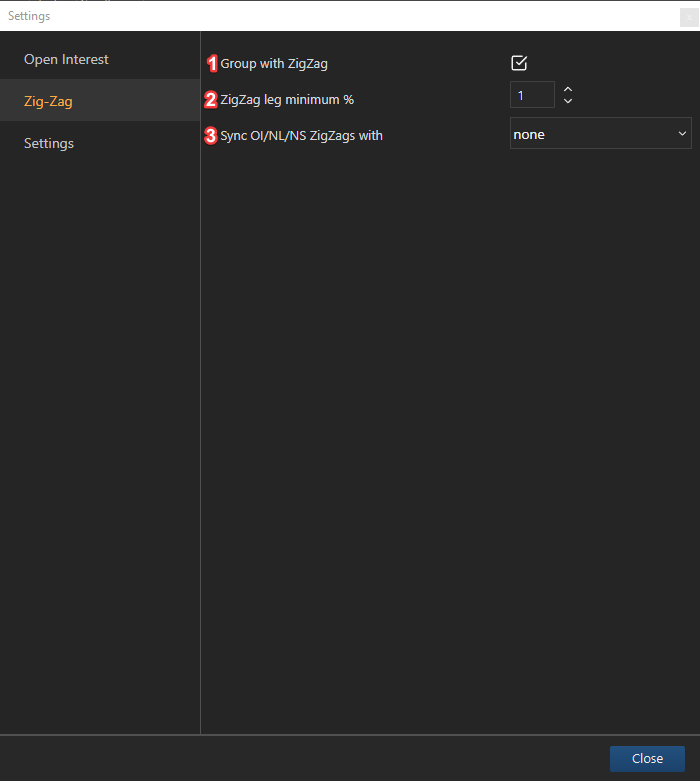
Zig-Zag settings
The Zig-Zag indicator plots points on a chart whenever values change by a percentage greater than a pre-chosen variable. Straight lines are then drawn, connecting these points, to create a statistical graph in which the observation of OI can be made easier.

1 - Group with Zig-Zag: switch on/off Zig-Zag indicator;
2 - ZigZag leg minimum %: defines Zig-Zag line reversal conditions, delta value in percentage, min - 0,01, max - 100;
3 - Sync OI/NL/NS Zig-Zags with: synchronizes OI Zig-Zag reversal points, on the time scale, with selected Zig-Zag. OI Zig-Zag will redrawn according to selected Zig-Zag reversal points;
None - No synchronization;
OI Zig-Zag - displays OI Zig-Zag;
NL Zig-Zag - OI Zig-Zag redrawn by NL reversal points;
NS Zig-Zag - OI Zig-Zag redrawn by NS reversal points;