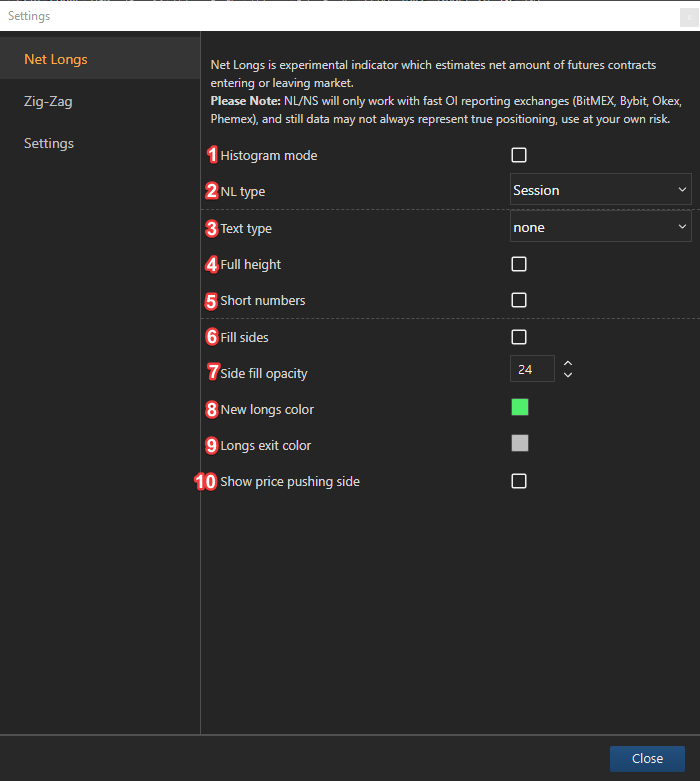
Main settings
!!!NL and NS settings are the same!!!
Net Longs (NL) and Net Shorts (NS) is an experimental indicator that estimates the amount of future contracts entering or leaving the market. It works only fast OI reporting exchanges (Bitmex, Bybit, Okex, Phemex). The calculation algorithm is based on the price and Oi fluctuations:
Price UP, OI UP = New Longs Price Down, OI UP = New Shorts
Price Down, OI Down = Long Covering Price UP, OI Down = Short Covering

1 - Histogram mode: display NL/NS in the cumulative, or histogram mode. In histogram mode, every candle starts from horizontal axis, candle height represents NL/NS value over the respective candle on the chart. All the candles placed on the horizontal axis, zero line. Candle direction represents positive, or negative delta. Non histogram mode, every candle drawn in respective to the previous values in cumulative mode, representing accumulated value by the candle position on the vertical axis;
2 - NL/NS type: work only in non histogram mode, defines accumulation period;
Session - NL/NS value accumulated starting from the beginning of the present session;
Visible range - NL/NS value accumulated starting from the visible range;
Full data - NL/NS value accumulated starting from selected candle lookback period, from the chart candle period menu;
3 - Text type: displays text at the top, or bottom of the candle. If candle positive, text displayed on top of the candle, if candle negative, text displayed at the bottom of the candle;
None - no of the text displayed;
NL/NS Close - displays NL/NS candle close value;
NL/NS Delta - displays NL/NS delta value, within the candle;
NL/NS Delta % from OI - displays NL/NS delta form OI value in percentage, within the candle;
ZigZag - under development;
4 - Full height: vertically distributes (fit to height) NL/NS candles;
5 - Short numbers: shortens numbers to thousands (T), millions (M), or billions (B);
6 - Fill sides: enables background color;
7 - Side fill opacity: changes background color opacity, mini - 1, max- 100;
8 - New longs/shorts color: changes color of the new Longs/Shorts;
9 - Longs exit color: changes color of the closed Longs/Shorts;
10 - Show price pushing side: the pushing side is calculated by algorithm, analyzing market activity and identifying markle pressure direction. Pushing sides displayed as vertical lines. Lines below the candle (default color blue) identifies bullish market, lines on top of the candle going up identifies bearish market.