Chart Period Setup
General Candle Settings
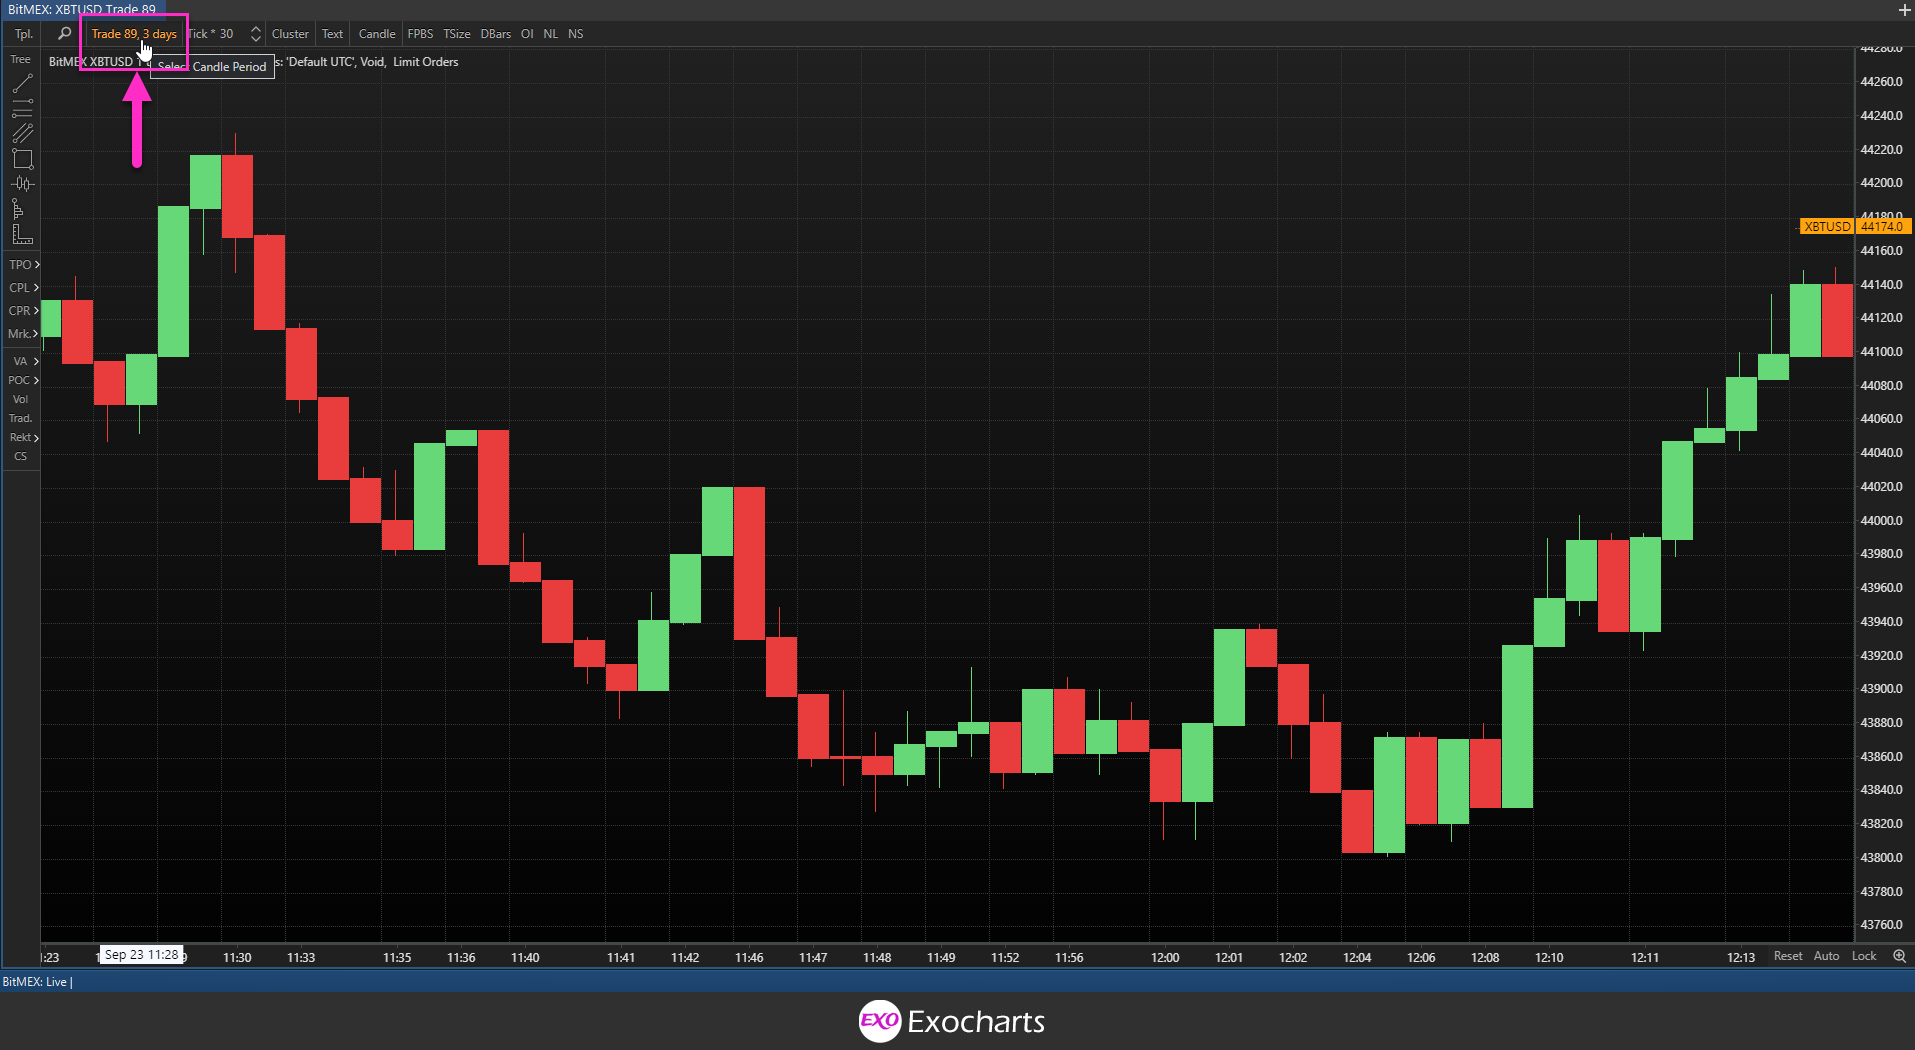
In Exocharts, you can configure your charts look back, period and type, from the toolbar by clicking on the area, as shown below.

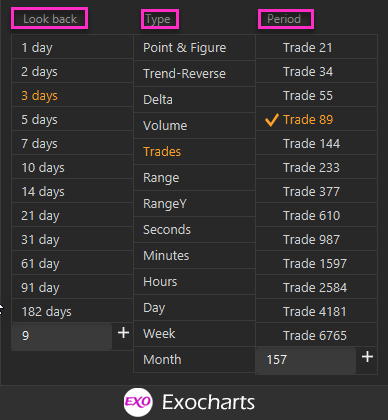
The dropdown menu consists of three sections:
- Lookback – the amount of historical data to be shown on the chart
- Type – the type of chart you want to use (Ranged-based, time-based or quantity-based).
- Period – the rotational period for each candle (time for time-based charts, volume intervals for volume charts, etc.)

The Lookback and Period sections, feature presets you can use. You also have the option of entering custom figures in the appropriate input box.
When you click on the input box, you’ll see recommendations on Smart Inputs to make it easier to enter your desired value. For example, in the lookback input box, you’ll see you can enter 2y, which will show you two years of data prior to the date you are currently at. In the rotational period input box, you’ll find that you can enter 3M for 3,000,000 or 9.5k for 9,500.
Once you’ve entered a custom lookback or rotational period, it will be saved in the list of presets for feasible accessibility in the future.
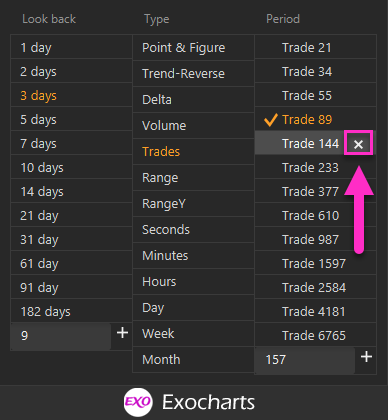
Remove presets by clicking on the X icon that appears when you hover your cursor over the setting.

Changing the type and period of a chart, can be done by simply clicking on the desired setting. To change the lookback interval, click on the desired amount of historical data, then on the period of chart to load the data.
Note:
Some offset might occur in non-time-based charts due to gaps, slippage, and candle normalization. In other words, a 10-tick range candle might actually range up to 12 or 14 ticks between the high and the low.
Cryptocurrency markets have a relatively thin order book, which means that gaps between trades aren’t unusual. Exocharts fills these gaps in the same candle by registering 0 trades per cluster bar.
These offsets can also occur if you’ve set aggregated market orders as the data source. In this case, candles will be plotted as long as the trade is fully executed against the book, meaning that slippage has been included in the candle.
Candle normalization can also cause offsets. This option in Source settings is designed to reduce market noise. Therefore, if a candle is printing very quickly, Exocharts will continue to plot that candle for a set timeframe to reduce noise. This only applies to non-time-based charts.