Time-Based Charts
Time-Based Charts:
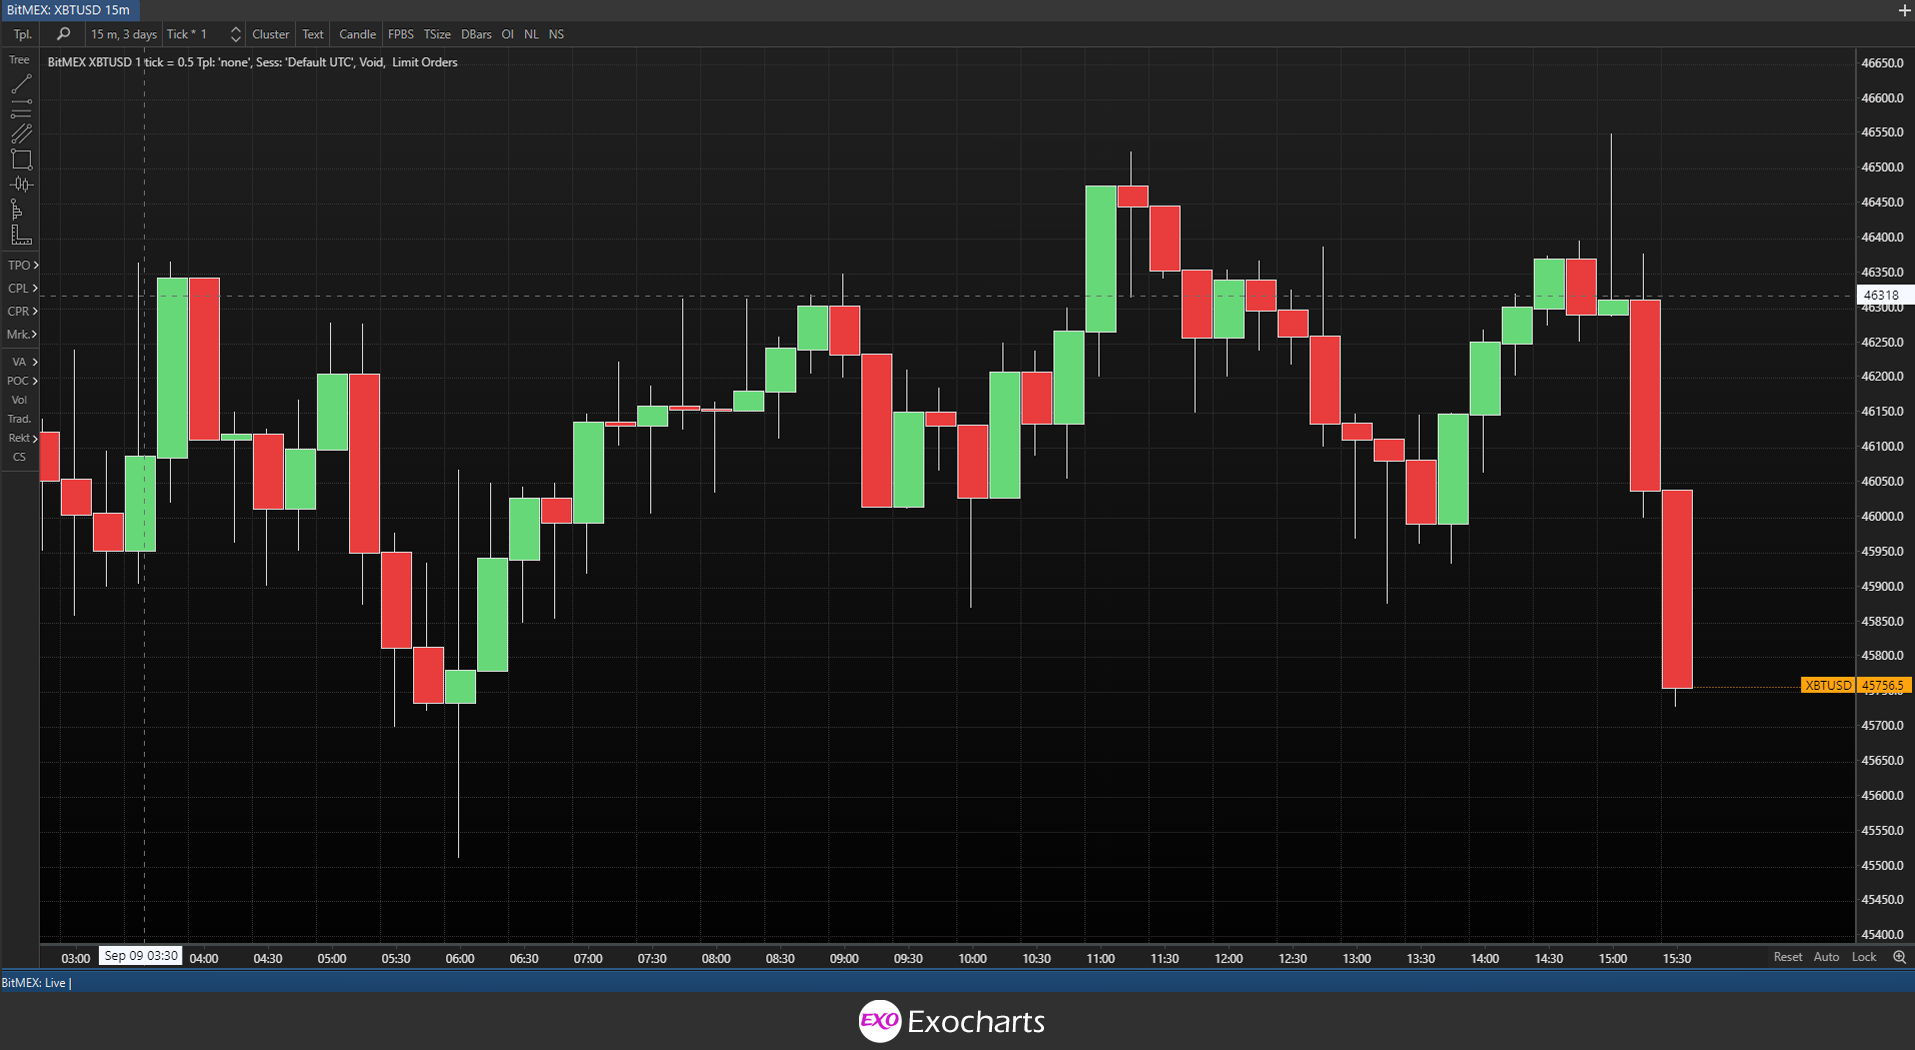
Time-based charts or rotation periods are what most traders are used to using. On a time-based chart, candles are plotted using time as the primary variable. Thus, even if there is no price movement, a candle will still be formed on a time-based chart, though it will appear simply as a horizontal line.
For example, on a 15-minute chart, a new candle will form every 15 minutes, regardless of what’s happening in the market. Therefore, on these types of charts, a candle represents a unit of time, whereas how the candle is drawn represents price activity.

If trading and price activity occurs, the candle will depict the high, low, open, and close of that asset’s price during that selected unit of time. This means that every trading session will have the same number of candles determined by the period you set.
In Exocharts, you can use time-based charts with intervals ranging from one second to 1 billion months.
It is key to note that by upgrading your Exocharts subscription to a more premium version, allows you access to all time variables, that may not be available on your current subscription.