Volume Profile
The Volume Profile cluster type, represents the total volume traded at specific prices during the candle rotation period. This results in a statistical distributional spread of traded prices.
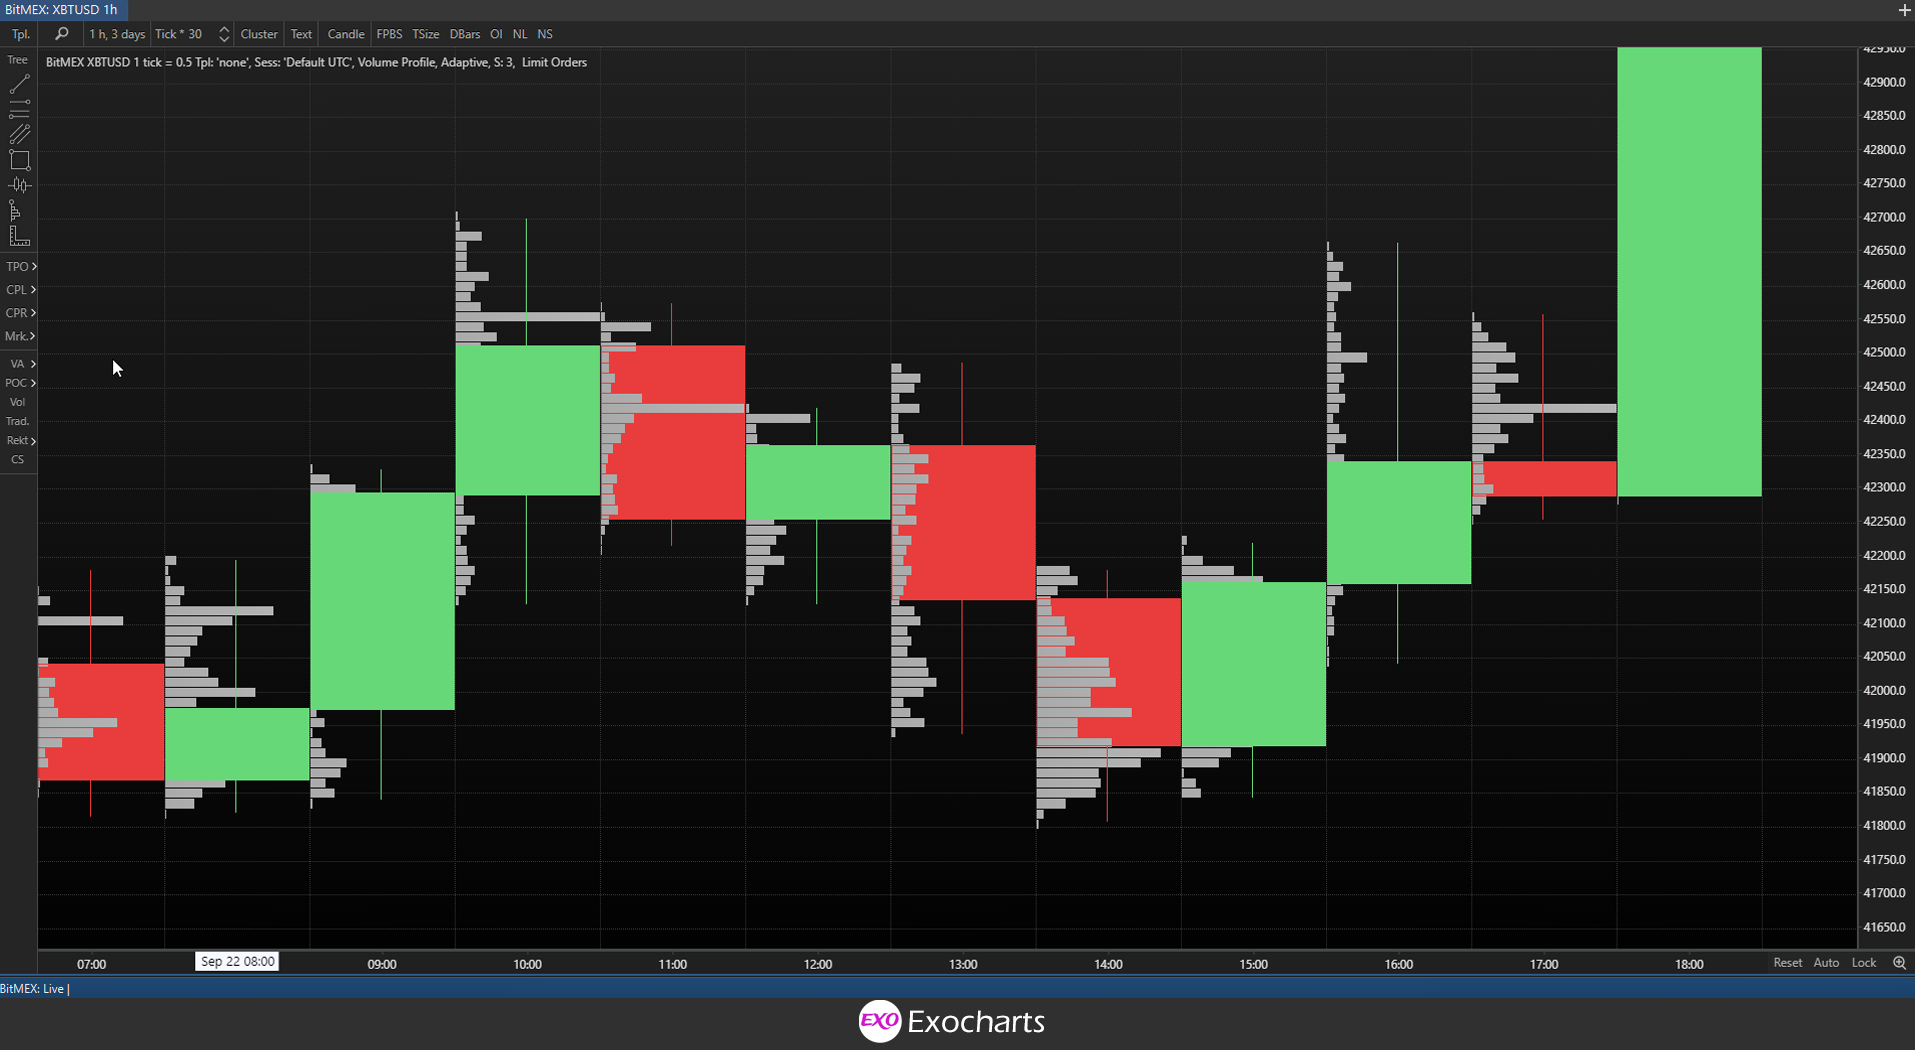
An example of Volume profile clusters with default settings, showing the main elements:
- Point of Control (POC) - The price within the rotation period at which the most volume was traded (Red bar).
- VA (Value Area) - The price range in which a specified percentage of the total volume of the profile was traded. This percentage is by default 68% as this approximates one standard deviation from the POC (Light grey bars. Bars outside the VA are transparent and appear darker).
- VAH (Value Area High) - The highest price within the Value Area.
- VAL (Value Area Low) - The lowest price within the Value Area.
The Volume Profile Cluster is an overlay that can be used on any type of chart to show more information on the volume traded of an asset. It reveals how much of an asset was traded at a specific price level.

In a simple volume chart, you can see that each candle represents the specific volume you set, meaning that each candle might represent 500,000 bitcoins traded, for example. However, you only see aggregated information.
With the Volume Profile Cluster active, you can dig deeper into each candle, as you will be able to see the volumes traded at each price point within the candle, for more accurate data.
The Volume Profile Cluster overlay can be activated on any type of chart to show you more details about the influence on the greater volume of orders, at specific price levels. Thus, when the market reaches that specific price, you can better estimate how traders will react.
For example, a price point with a high volume of trading is indicative of a healthy trend in prices current direction. Conversely, a price point with a low volume of trading is indicative of an unhealthy trend in prices current direction, suggests a reversal of price action or a failed auction (price breaches into a new area of price on low volume is indicative of price to return to the previous VA as it is rejected by the market).
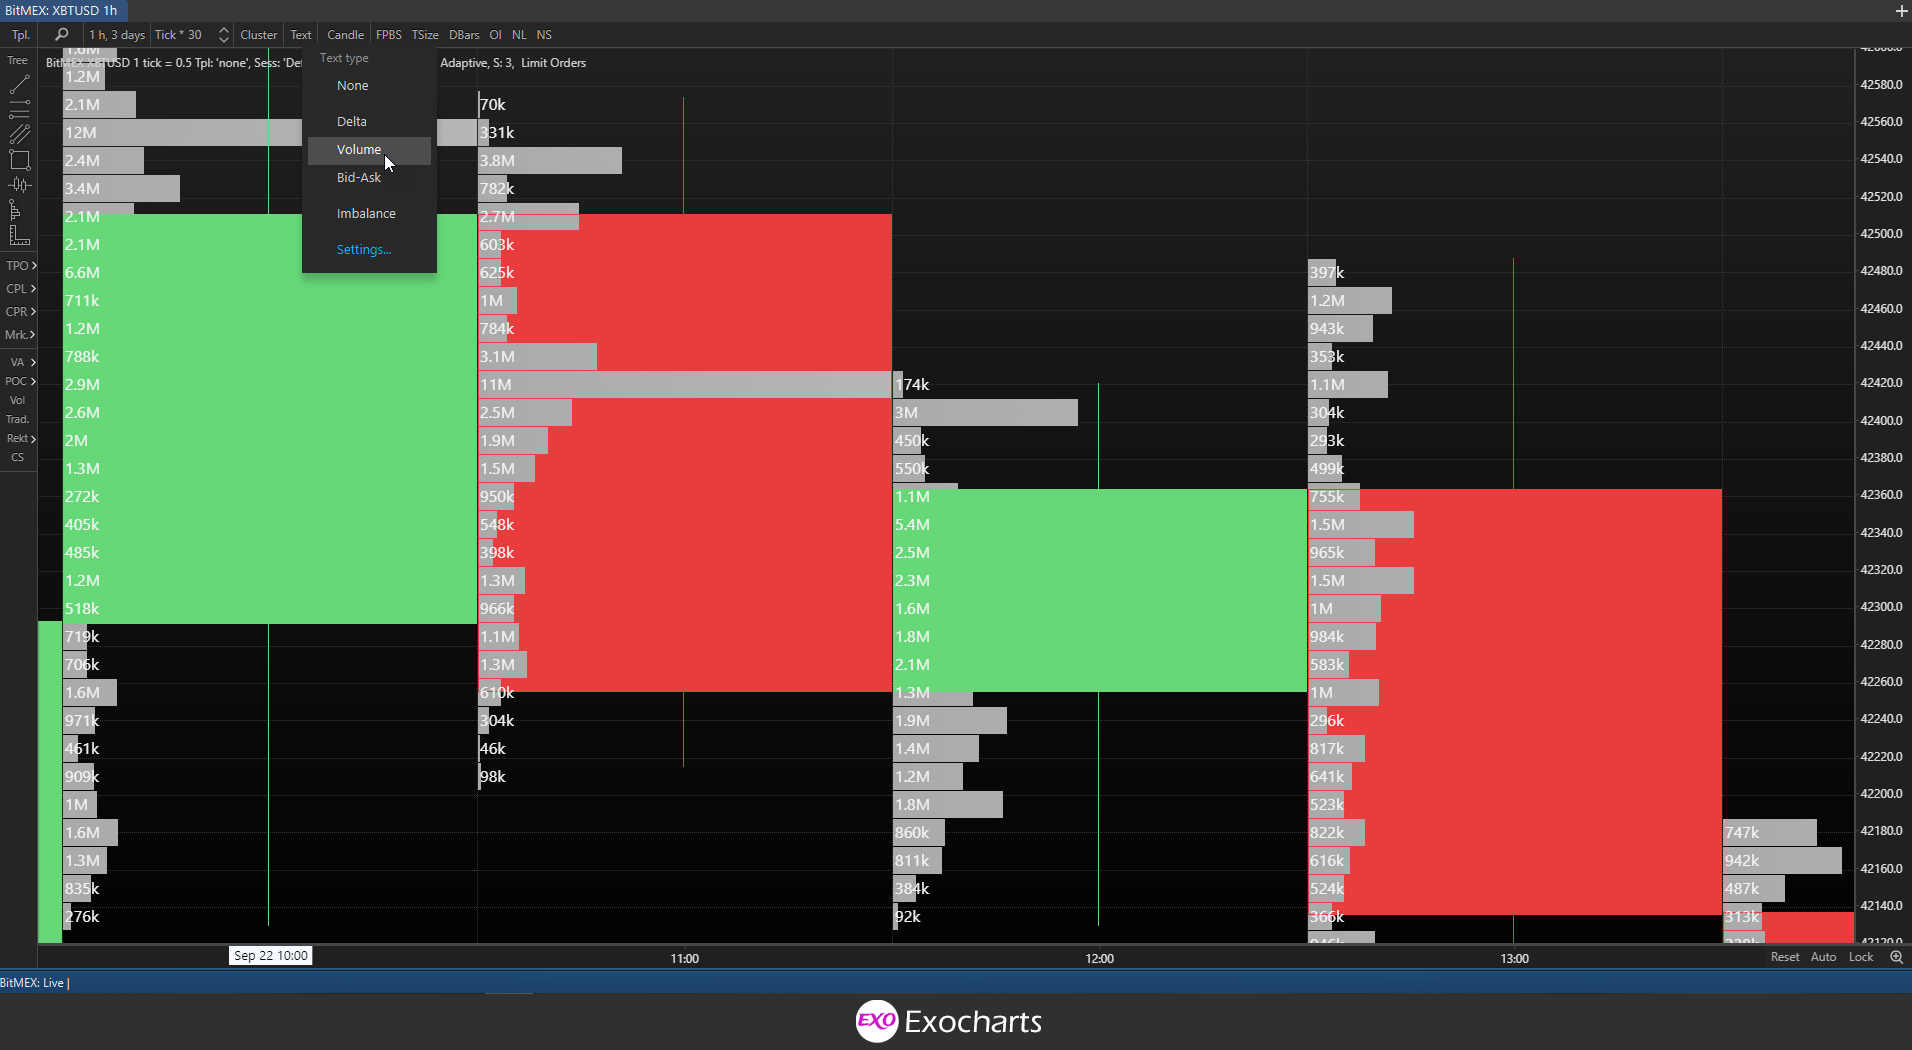
For an even more accurate understanding of what is occurring in the market, you can activate the Text: Volume, Delta, or Bid-Ask options, which will show you the exact volume, Delta, or Bid-Ask figures, as you can see below.

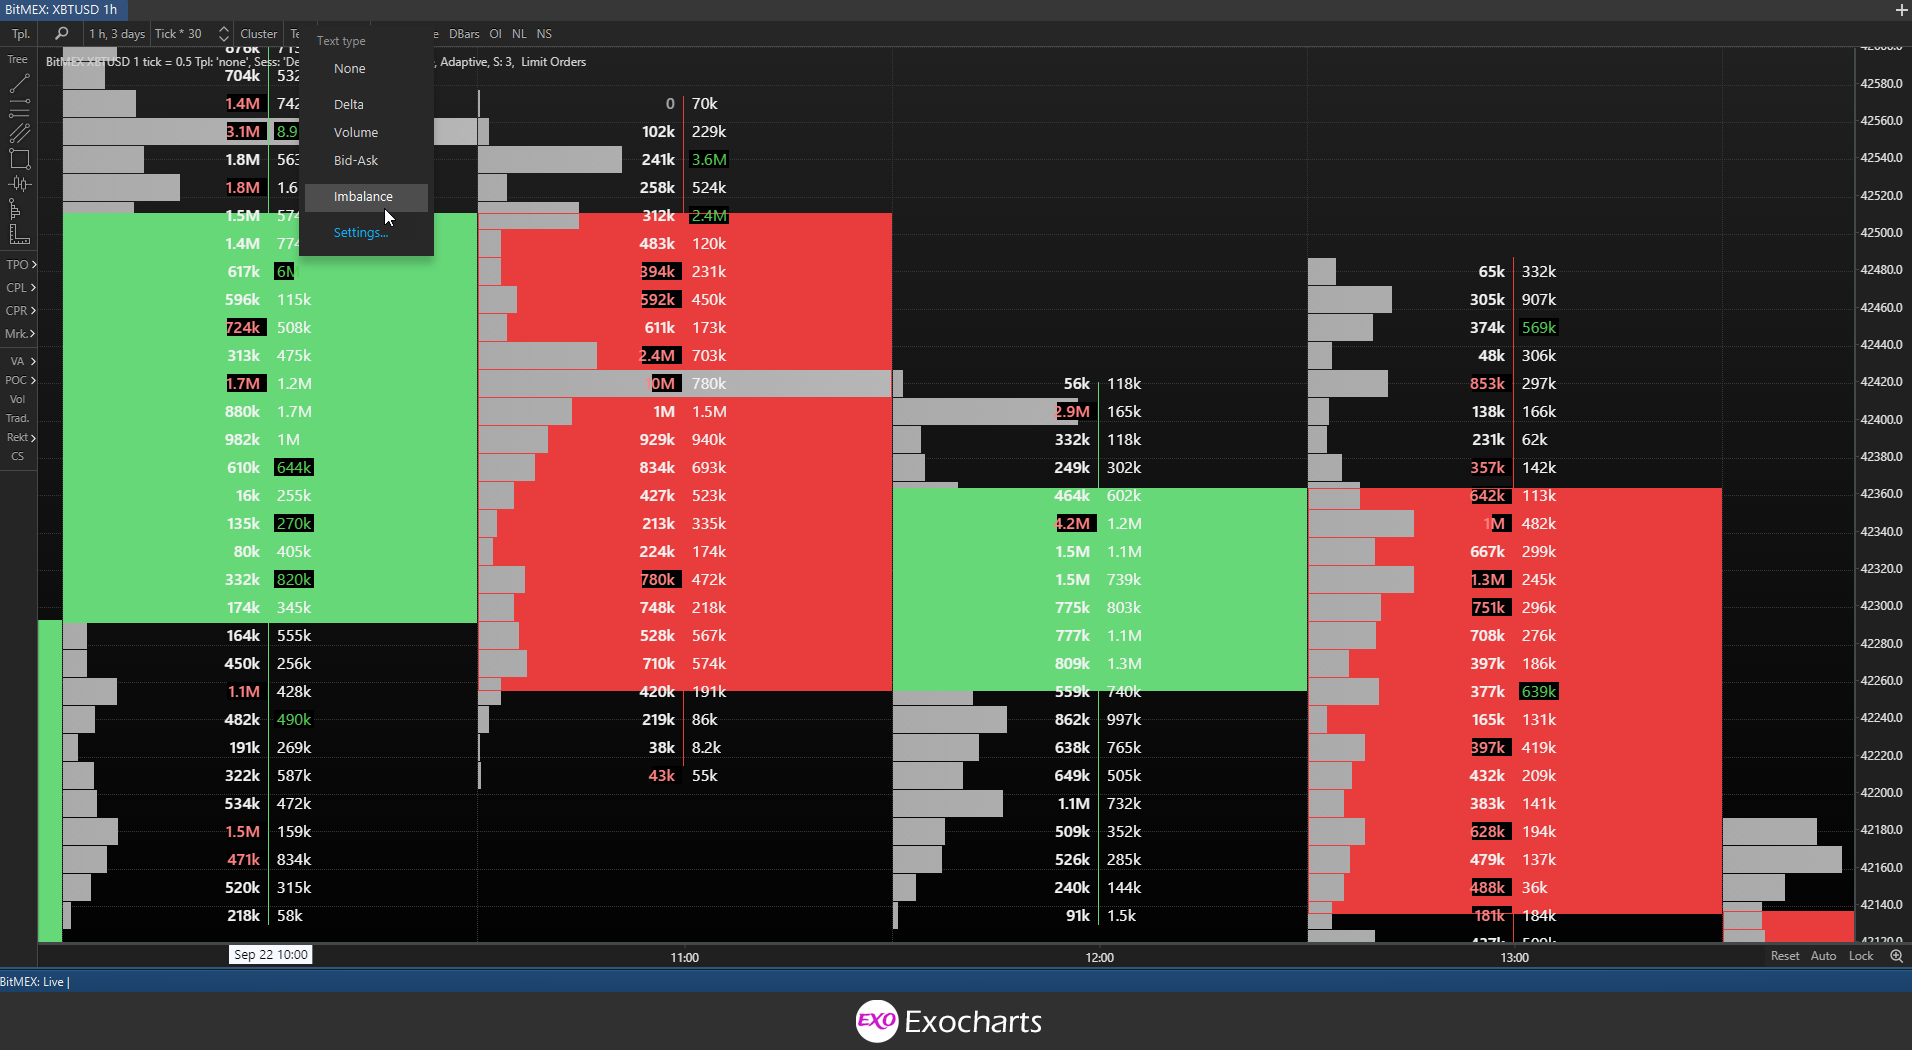
You can also activate Imbalances, which shows where there are proportionally more buyers or sellers, with the most commonly used percentages being 250%, 300%, and 400%.
An imbalance on the buy-side indicates that the quantity purchased was greater than the amount traded on the bid by the specific ratio being used. The reverse is true of an imbalance on the sell-side.
Imbalances can provide one with trading opportunities, as it signals to traders of a possible break-down/up of price, as imbalances begin to stack (3 or more imbalances on top of each other) is signalling that there’s an overwhelming amount of aggressive buyers or sellers in the market. In combination with the volume profile overlay, allows you to see the most influenced areas of imbalances.

In Exocharts, you also have the option of adjusting how you see each candle. For example, you can select the standard bordered candle and use the overlay on top of it. However, in some cases, you might find it difficult to see exactly what’s going on.
So, you can choose other options, such as having no candle printed at all, or simply a border candle, so you can still see the Open, High, Low, and Close, without it interfering so much with other data.

Note that you can adjust the level of detail you see by adjusting tick size, which will help eliminate some noise.
For example, if you set your tick size to 1, you will see the volume traded for every tick of the price. This is often too “micro” of a view, and the noise can make it difficult to see what is happening. Therefore, it might be a better option to increase tick size to eliminate unnecessary noise.
Of course, this also depends on how much price moves within a candle. The more extensive the price movement, the larger you will likely want your tick size to be.
Using Volume profiles
Volume profiles show what prices the market is willing to accept, and what prices the market rejects. Knowing the willingness of market participants to trade at certain price ranges can aid you in estimating the behaviour of the market when price is at those levels. The more volume at a level, the more willing the market is the trade there and the stronger the "attraction" of the price to that level, while the less volume at a level, the more likely the level is to be rejected.
