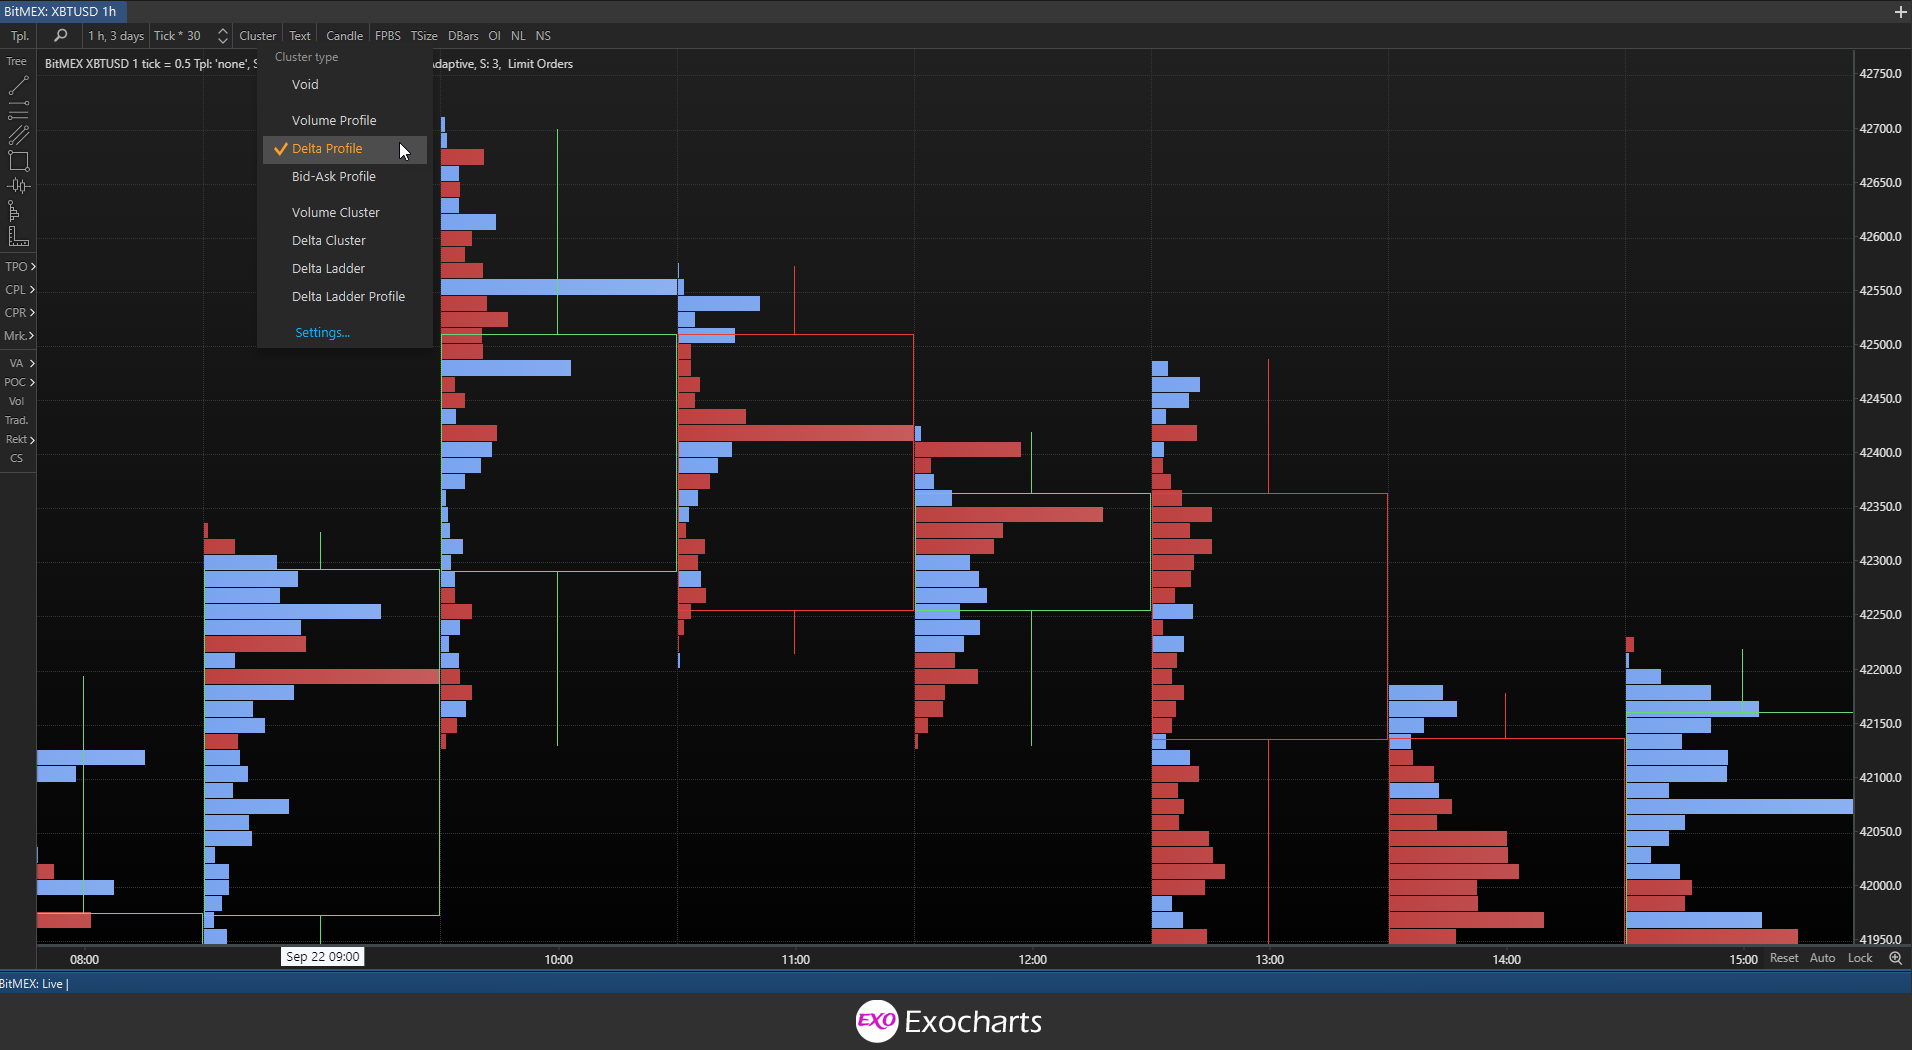
Delta Profile
The Delta Profile cluster displays the difference between the volume bought and the volume sold at each price point within a candle as a distributional spread of your candles rotation period chosen. In this profile below, you will see a statistical distribution of the Delta figures at every price level.

Detailed Delta information is important because it helps you determine how strong a trend is using volume. For example, if the price is rising, you would want to see strong, positive Delta which indicates a lot of interest on the buy-side to sustain the continuing rise.
The higher the Delta, the more aggressive buyers are entering the market with long orders, that typically concludes in a continuation of price trend.
Sometimes, Delta will be close to zero, which indicates a relatively equal amount of selling and buying, hence reduced market movement.
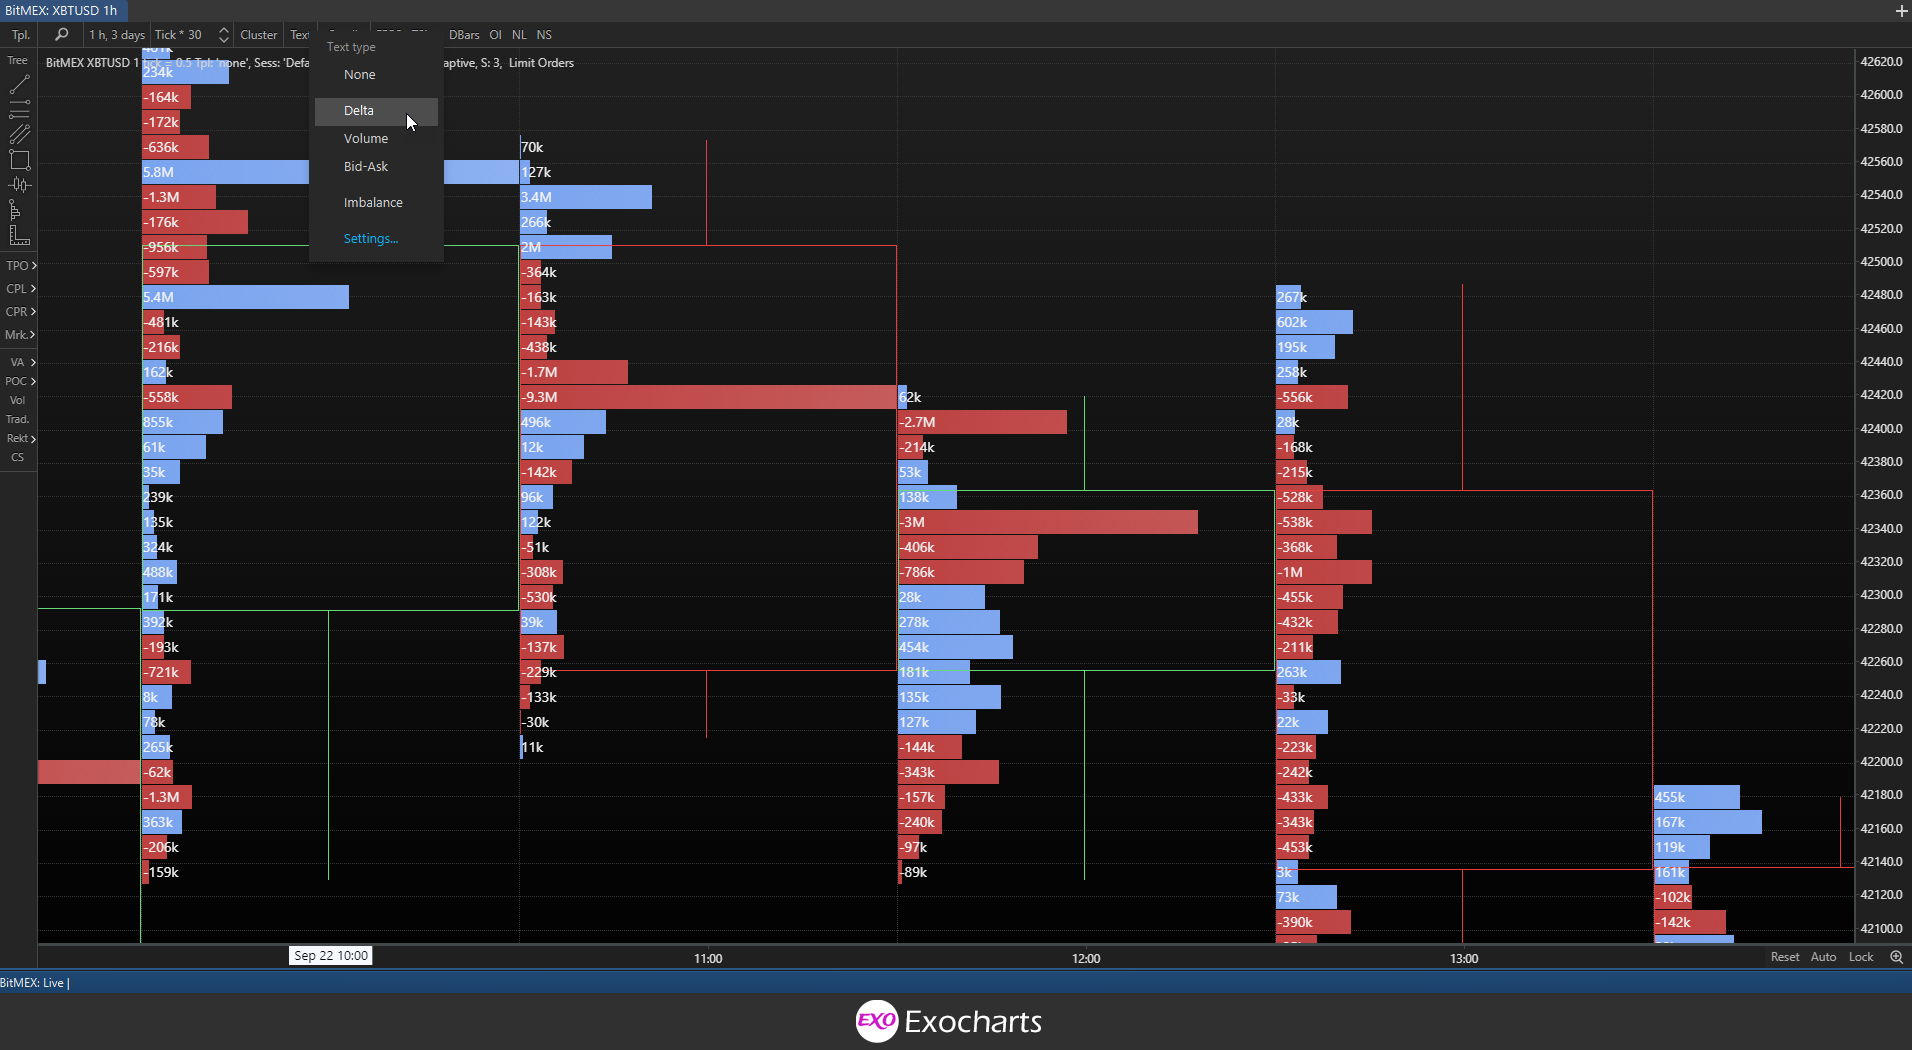
For more in depth information, in Exocharts you can activate the different text options. As with the Volume Profile Cluster, you can also activate Imbalances. You also have the option of modifying how you view each candle to make it easier to see the data.

Once again, you can also adjust tick size to eliminate noise. Generally, a tick size of 1 will be very noisy as it will show you price action at every tick point.