Chart window overview

1 - Tab name: shows selected pair symbol; Active Tab background colored in light grey color;
2 - New Tab open button;
3 - Templates menu: refers to templates management (Load, save, import and export);
4 - Chart settings: refers to exchange and pair selection menu;
5 - Candle settings: refers to the settings of the candle period, tick size, cluster mode, text mode, candle mode;
6 - Built-in indicators: refers to indicators selection Footprint bar statistics, Trades size, Delta bars, Open interest, Net Shorts, Net Longs;
7 - Drawing tools: refers to drawing tools selection Object tree, Line tool, Fibonacci tool, Linear Regression, Rectangle, Anchored vWap, Dynamic profile, Measure tool;
8 - Left toolbar plugins: refers to plugins selection Time Price Opportunity profile, Composite profile left and right, Markers;
9 - Addons menu: refers to the selection of the Value area, Point of control, Volume, Trades, Liquidations (Rekt), Candle statistics;
10 - Charts settings and mouse cursor hover information. First-row display charts settings information ( Exchange, pair, tick size, session, bar width calculation mode, bar width sensitivity, trades aggregation), the second-row displays information from mouse hovered object (Open, High, Close, Low, volume, delta, buys, sells);
11 - Chart window;
12 - Price axis;
13 - Last trade price indicator;
14 - CPR display area. Please note CPL and CPR are the same tools, except CPR is displayed on the right side and CPL is displayed on the left side of the chart;
15 - Built-in indicators display area;
16 - Built-in indicators vertical measurement axis;
17 - Horizontal time axis;
18 - Bottom toolbar:
Reset: returns chart to default view [Key Z];
Auto: Locks vertical dragging, keeps only horizontal dragging [Key X]. Auto-Off when the user uses the zoom feature;
Lock: Locks the last candle to the right [Key C];
Mouse scroll settings [Toggle Key V]:
 Zoom: Mouse scroll - Zoom, holding SHIFT - Pan, holding CTRL - vertical Zoom;
 Pan: Mouse scroll - horizontal Zoom, holding SHIFT - Pan, holding CTRL - vertical Zoom;
 Zoom time only: Mouse scroll - Pan, holding SHIFT - Zoom, holding CTRL - vertical Zoom.
How to Navigate

Scrolling - Scroll the chart left or right by positioning your cursor anywhere on the chart, holding down the left mouse button, and dragging right or left.
To scroll vertically, position your cursor on the chart, hold down the left mouse button, and drag it up or down.
Scaling and Zooming - Exocharts offers multiple zoom options. You can scale on the x-axis or horizontally, on the y axis or vertically, or both.
Scaling Vertically - To change vertical scaling, position your cursor over the price axis, hold down the left mouse button, and drag up or down.
Alternatively, position the cursor over the vertical price axis, and use the mouse wheel.
Scaling Horizontally - To change horizontal scaling, position your cursor over the time axis, hold down the right mouse button, and drag left or right.
Alternatively, position the cursor over the horizontal time axis, and use the mouse wheel.
Zooming In and Out - To zoom in or out (change both horizontal and vertical scaling), click the zoom button in the bottom right corner to show Zoom On.
Move your cursor onto the chart and use the mouse wheel.
Reset the Chart -To return the chart to the current bar and cancel any scaling, click on the Reset button on the bottom right.
Selecting the Data Source and Trading Instrument
Click on the Ticker button to expand the menu.

Select the exchange that Exocharts will source data from and the trading instrument of your choice.

Choosing the Type of Chart
To change the type of chart, click on the Rotation Period arrow to expand the menu.

Click on the chart type of your choice to load.

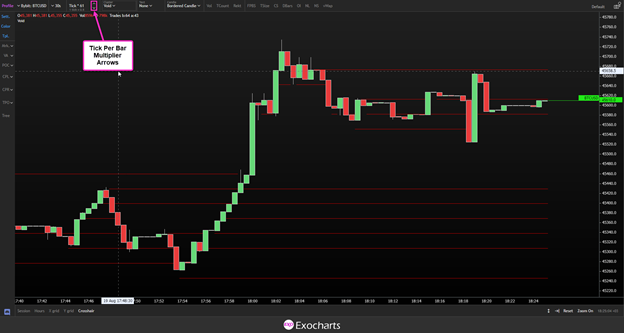
Modify Tick per Bar Multiplier
To modify the tick per bar multiplier, click the up or down arrows.
