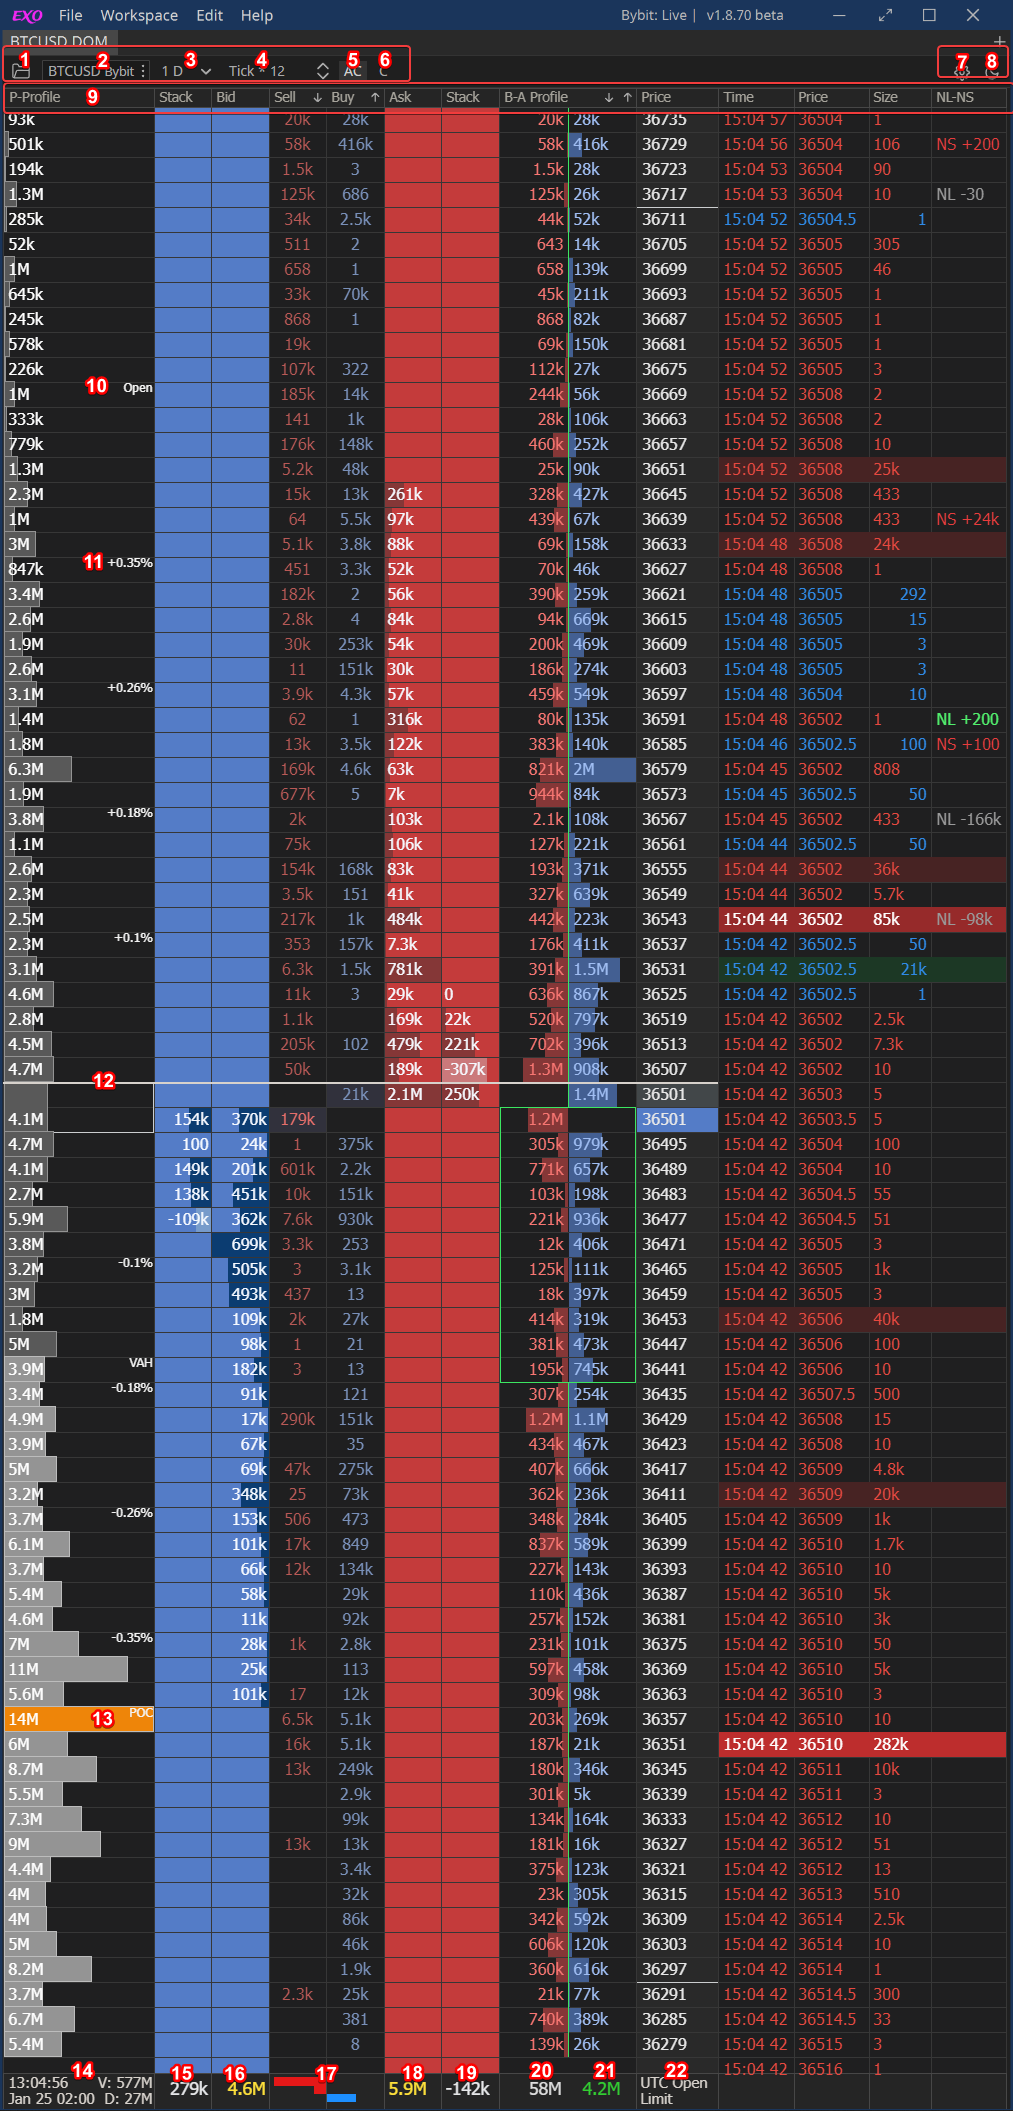
DOM & Tape window overview

DOM and Tape menu:
1 - Templates menu: refers to templates management;
2 - Exchange & pair menu: refers to exchanges and pairs selection;
3 - Period menu: refers to P-Profile period type and duration;
4 - Tick size: refers to DOM tick size setup;
5 - Autocenter: enables or disables DOM auto-centering to the last traded price. The function trigger levels marked on the price column as white lines;
6 - Center: this will allow manually center last traded price on the B-A profile column;
DOM and Tape settings:
7 - Settings: opens DOM and TAPE settings menu;
8 - Light/Dark: theme switching button, changes apply only to DOM & TAPE window;
DOM and Tape main window:
9 - DOM and TAPE columns:
P-Profile column: display volume profile of the selected period;
Stack (Bid & Ask) column: shows stacked and pulled Bids & Asks delta. A positive number means more Bids or Asks stacked than pulled, and vice versa. Cell shading level depends on the delta size;
Bid column: shows current Bids from the order book. Cell shading level depends on the Bid volume size;
Sell column: shows recent trades actively sold from Ask to Bid. The default cell reset time is 5 seconds (traded volume collection time);
Buy column: shows recent trades actively bought from Bid to Ask. The default cell reset time is 5 seconds (traded volume collection time);
Ask column: shows current Asks on the order book. Cell shading level depends on the Ask volume size;
Bid-Ask profile column: shows the same values as the Sell and Buy columns, except the auto-center function does not impact them. The last price centering could be done only by the Center button; Within B-A column real-time candle frame is drawn.
Price column: shows DOM price axis. White line markers indicate auto-center function activation levels;
Timeline column: shows a timeline of the trades;
Price column: shows price levels of the trades;
Size column: shows volume per trade;
NL-NS column: shows Net Long and Net Short changes. Incoming Longs colored in green color, Shorts in red color, Outgoing Longs and Shorts colored in grey color;
10 - Open/Close: shows open and close price levels of the volume profile period;
11 - Scalping levels: shows every 0,5% price range from the last trade price;
12 - Auto-center level line: updaters automatically when reaches auto-center triggers if AC function selected;
13 - POC and vWap markers: show Point of control and vWap levels of the volume profile;
14 - Volume profile summary: shows the outline of the selected period, running time, total volume, Delta volume, and current date;
15/19 - Bids or Ask stack summary: shows total stacked Bids or Asks delta volume. Value calculated according to Pull-Stack --> Max. rows settings;
16/18 - Bids or Ask summary: shows total Bids or Asks volume. Value calculated according to Main settings --> Max. rows settings;
17 - Trades multimeter: it consists of two cells, the right cell refers to active sales, left cell refers to active buyers. Every cell has 3 horizontal bars, top bara refers to trades activity, the middle bar refers to Bids and Asks volume, and the bottom bar refers to pull-stack delta volume;
20/21 - Sell and buy summary: shows the total volume of buys and sells over the period;
22 - Session info: shows current session details.