TPO & Quick access menu
TPO (Time, Price, Opportunity) - displays price distribution over the selected period as profile, known as Market Profile. The TPO highlights levels where the price has spent the most time. However, it is similar to the volume profile often used in conjunction with the volume profile to identify support and resistance areas.
In Exocharts TPO chart is available as a versatile, flexible, and easy setup tool. There are two levels of settings quick access and complete settings. Quick access setting available from the left toolbar from the drop-down menu. Full settings are accessible from the drop-down menu or via the main settings menu from the TPO tab. The quick access menu appears by pressing the arrow beside the left of the TPO.

* Quick access menu
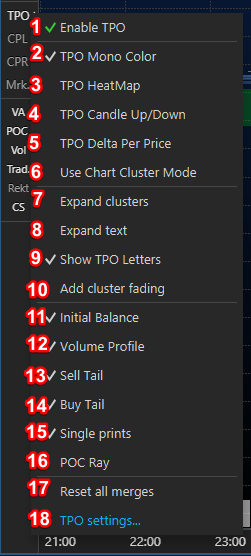
1 - Enable TPO: on/off TPO profile. The same function works by pressing on TPO from the left bar menu;
2 - TPO Mono Color: changes TPO color scheme to mono colors. By default value area is colored in gray, and the outside value area is colored in blue colors;
3 - TPO HeatMap: changes TPO color scheme to HeatMap colors. HeatMap techniques display magnitude by changing color;
4 - TPO Candle UP/Down: changes TPO color scheme to candle up/down scheme. If the bar value is positive (open price higher than close), letter bar colored in green, if bar value is negative (open price lower than close) letter bar colored in red;
5 - TPO Delta Per Price: changes TPO color scheme to delta price colors. If the price delta is positive, the appropriate letter bar is colored in blue color. If the price delta is negative, the appropriate letter bar is colored in red color;
6 - Use Chart Cluster Mode: changes view and color scheme as selected in the main chart cluster mode. It will apply the last setup of your main chart. By changing the cluster mode type, changes immediately affect the TPO and the main chart;
7 - Expand cluster: expands clusters horizontally by the timeline. Cluster size depends on the selected candle period;
8 - Expand text: expands TPO letters horizontally by the timetable. The time frame depends on the chosen candle period;
9 - Show TPO Letters: on/off TPO letters view;
10 - Add cluster fading: on/off cluster color fading effect. The fading impact spreads to lighter and darker shades from the present color;
11 - Initial balance: on/off the embedded candle of the first 30minutes trades of the TPO profile;
12 - Volume profile: on/off volume profile view;
13 - Sell Tail: on/off sell tail area view on the chart. The selling tail is a series of single tail letters at the top of the profile;
14 - Buy Tail: on/off buy tail area view on the chart. The buying tail is a series of single tail letters at the bottom of the profile;
15 - Single prints: on/off single print area view on the chart. A single print is when a single TPO letter is printed on a particular price level;
16 - POC ray: extends POC line to the right edge of the profile;
17 - Reset all merges: Resets all the merged TPO profiles to the sessions. By default, the TPO profiles are built for each session and the session could be merged into one profile;
18 - TPO settings... - access to the TPO complete settings.