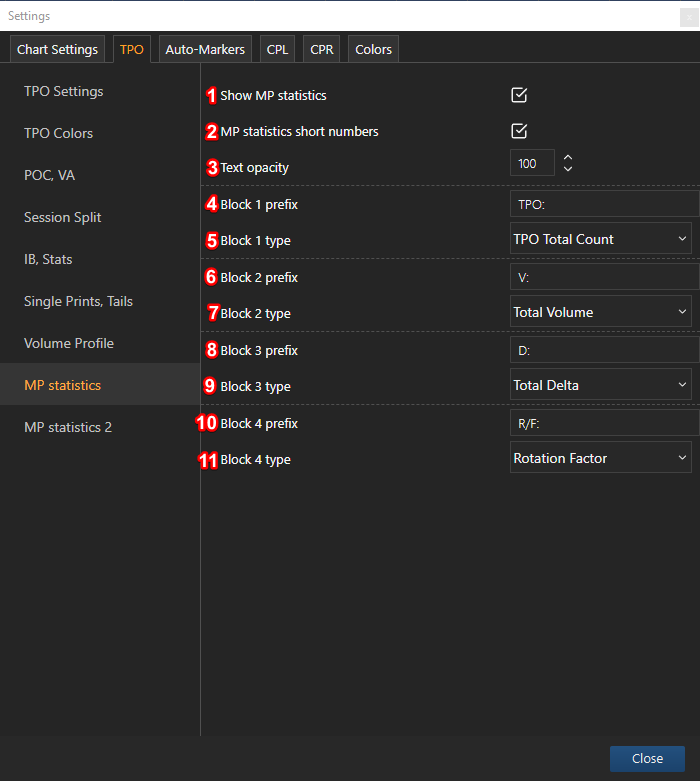
Market profile statistics settings
Market profile statistic - user-defined profile data summary displayed at the top of the profile.

1 - Show MP statistics: on-off MP statistics view;
2 - MP statistics short numbers: shorten the MP statistics numbers for more convenient reading;
3 - Text opacity: change MP statistics text opacity (min - 1, max 100);
4 - Block 1/2/3/4 type (define each block type, the same options for all four blocks):
None - none information of the block is displayed;
TPO Total Count - count the total count of the TPO profile clusters;
Total Volume - count the total volume of the profile;
Total Delta - calculate whole profile delta;
Rotation factor - count of the rotation factors (rotation factor - method to assign a value to each time period: If the highest price of the current time period is higher than the previous time period’s highest reached a price, rotation = +1, If lower =-1. the same logic applied to the lowest values);
Start date - display start date and time of the TPO profile;
Profile Open - display TPO profile opening price;
Profile Close - display TPO profile closing price;
Profile High - display TPO profile highest price;
Profile Low - display TPO profile lowest price;
Profile Range - display TPO profile price range delta;
IB Range High - display TPO profile IB highest price;
IB Range Low - display TPO profile IB lowest price;
IB Rage - display TPO profile IB price range delta;
VA High - display TPO profile VA highest price;
VA Low - display TPO profile VA lowest price;
VA Range - display TPO profile VA price range delta;
VA % settings - display chart settings VA percentage;
TPO POC - display POC of the profile value;
TPO vPOC - display volume POC of the profile value;
TPOs Above/Below POC - display the numbers of TPO's clusters above and below of the POC;
TPOs Above Below POC % - display the percentage of TPO's clusters above and below of the POC;
Vol. Above/Below POC - display the volume distributed above and below of the POC;
Vol. Above/Below POC % - display the volume in percentage distributed above and below of the POC;
CVD Above/Below POC - display the cumulated volume delta above and below of the POC;
Avg Candle Range - calculate average candle building price range.