Why are my marker settings different?
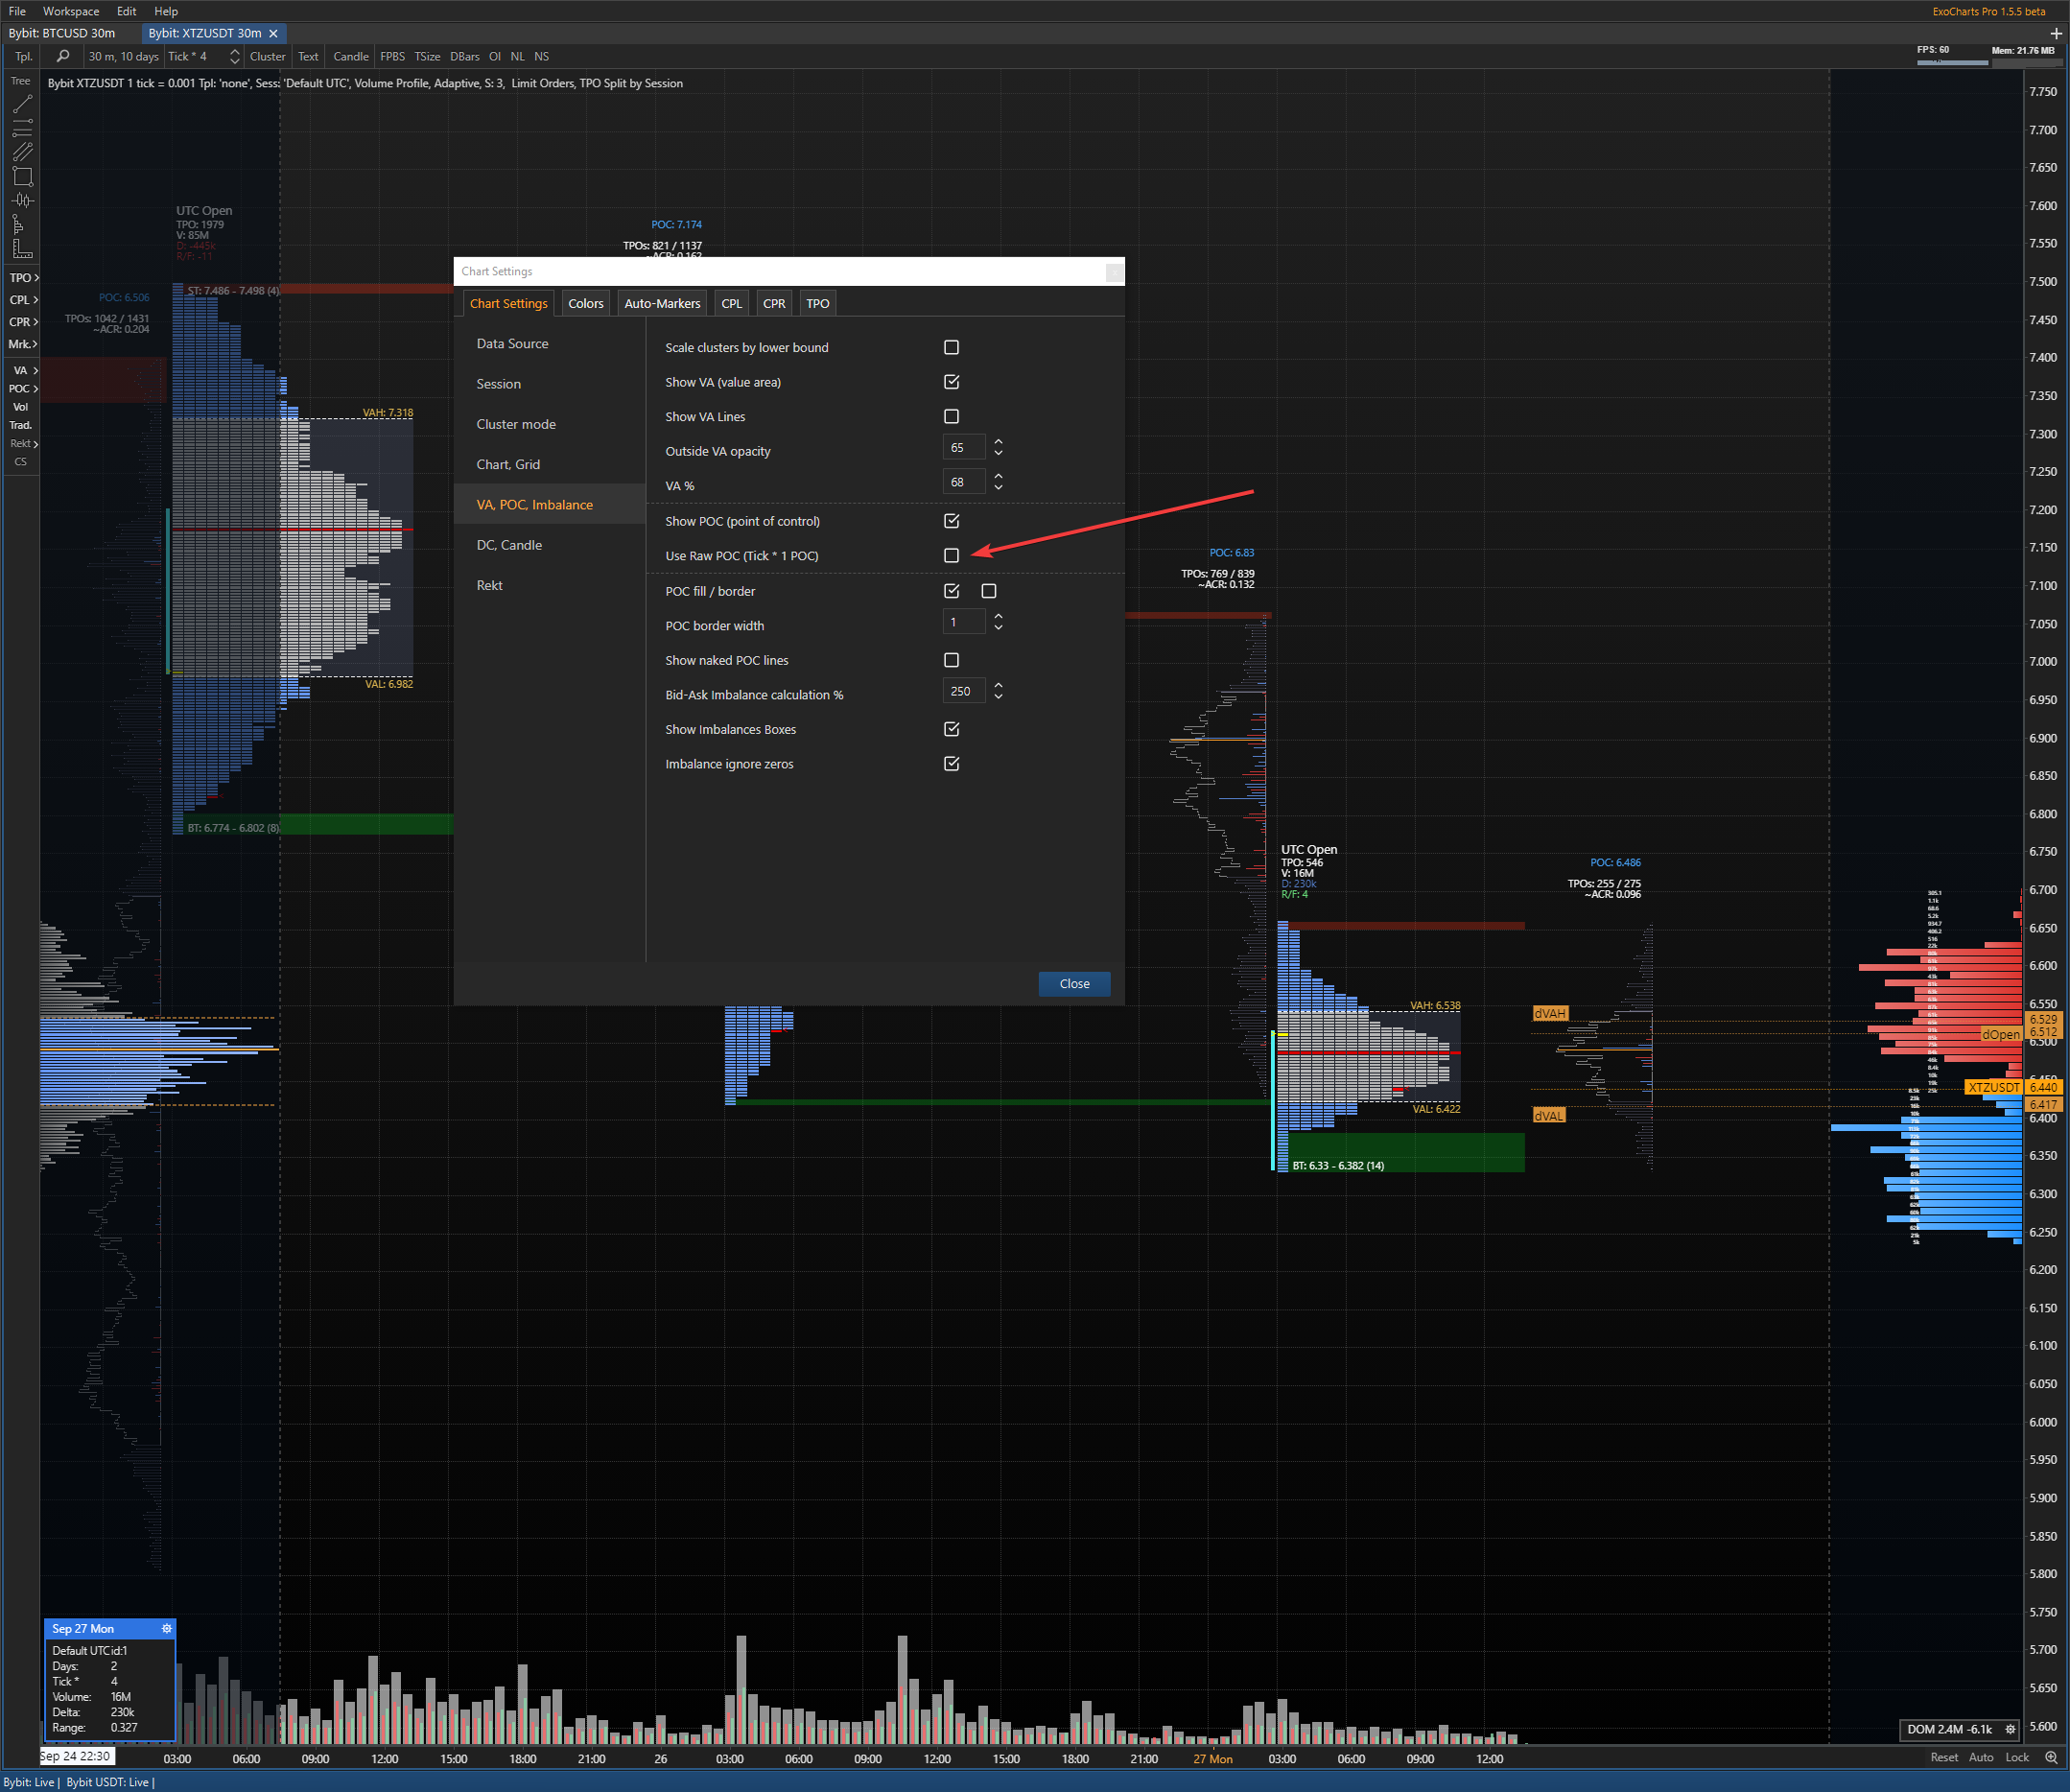
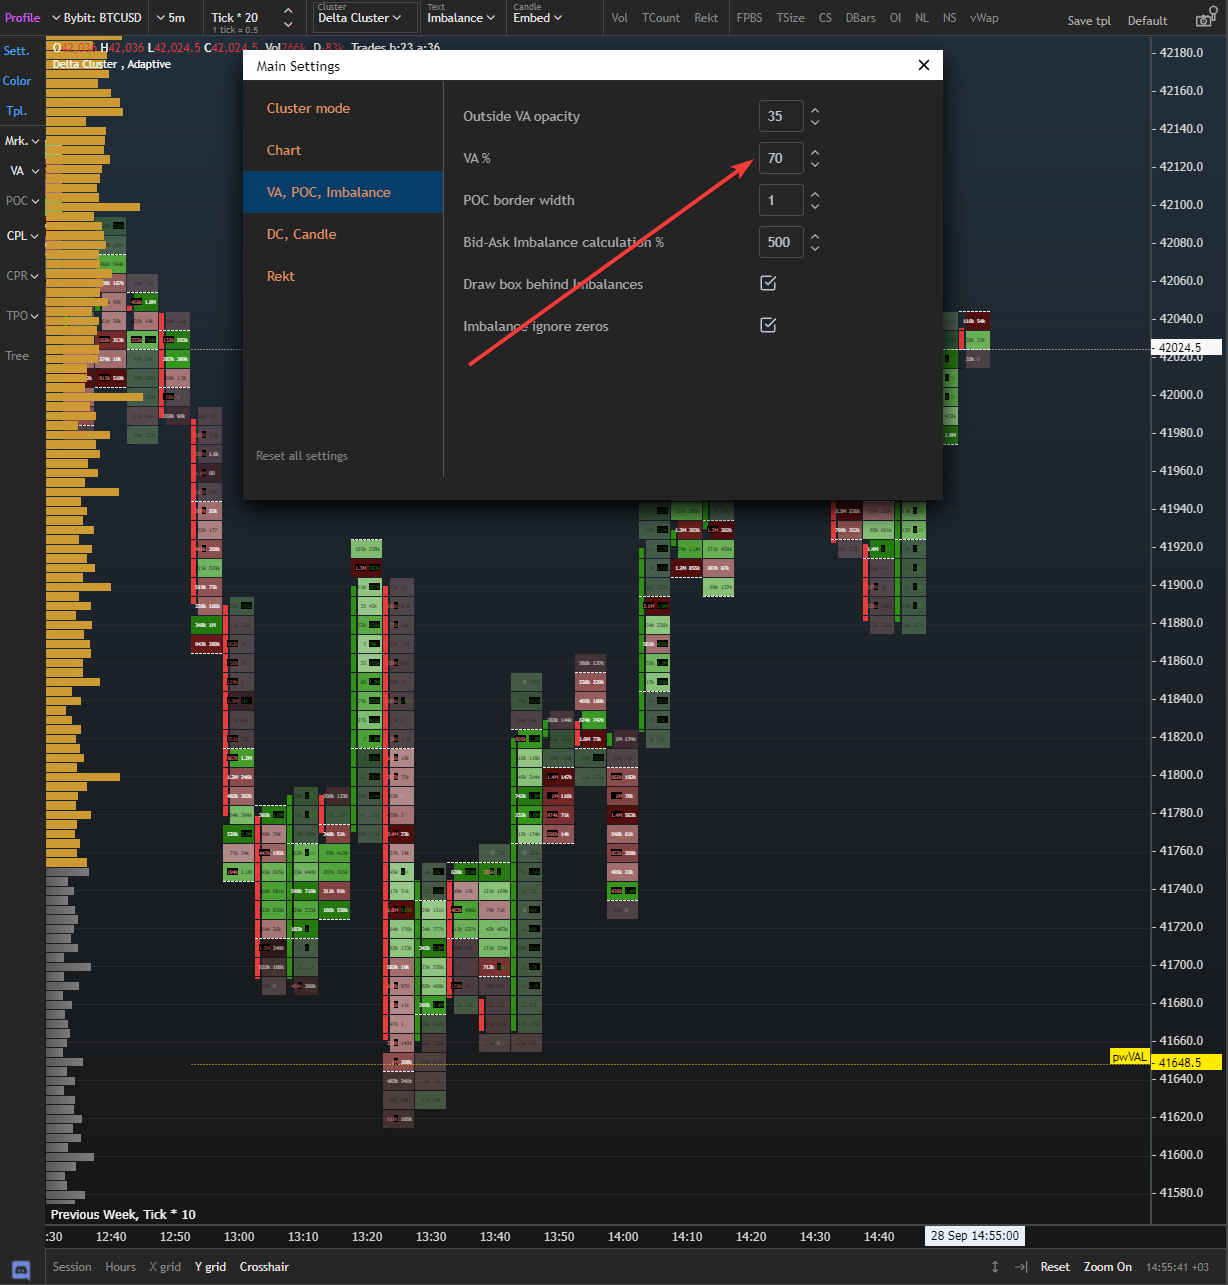
The difference occurs because of tick size and Value Area settings. Please check your settings as shown in the screenshots below.
The images below show the standard TPO chart’s VA settings and a standard delta cluster embed charts VA settings:


What to notice?
You may notice, that the images do not display an area where you are able to change the numerical value of the tick size. This is due to the tick size of your VA settings being that of the pre-chosen tick size for your chart. This can be found in the row of functions towards the top of your screen. Simply change the number inside to change your charts VA tick size.
Furthermore, both images show different VA% settings. For the VA% settings i would recommend a percentage of 68 as this approximates to one standard deviation from the POC. Simply click on the box where the number is set for VA% and configure to your preferences.
The different concepts:
It’s key to be cultivated in why specifically, TPO charts VA’s are different to standard charts. The acronym TPO stands for Time, Price and Opportunity hence, time is the foundation of the TPO profile. The TPO profile consists of the distribution of time, represented by letters of lower and upper cases that equate individually to 30min. Then standard settings such as VA% and tick size are used to manifest the VA markers. I would recommend for a daily TPO chart to use a tick size of 50.
On the other hand, non-TPO charts have VA profiles that are based from volume, meaning regardless of having equal VA% and tick sizes as other charts, its VA’s will be different.
Ways to tell:
One way to tell the difference in VA markers, is by overlaying a standard TPO profile with an additional volume profile. This way you are able to compare the discrepancies between the concepts of Time and Volume and its VA’s. I highly recommend to do this when using a TPO chart as it gives you an advantage when considering market changes.