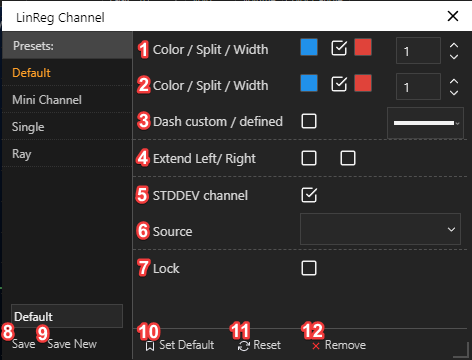
LinReg (Linear Regression) channel settings
The linear regression indicator plots prices, over time, along with a normal distribution. This tool is used in technical and quantitative analysis in financial markets. Standard deviation lines indicate overbought and oversold areas, as well as entry price, stop-loss, and exit prices.
LineReg indicator has 4 commonly used, built-in presets, Default, Mini Channel, Single, Ray.

1 - Color / Split / Width: changes standard deviation lines settings. Color - changes the background color of positive price deviation area/switches on or off deviation lines / changes the background color of negative price deviation area/changes deviation lines width;
2 - Color / Split / Width: changes mean lines settings, available only when the standard deviation is switched on. Color - changes the background color of positive price deviation area/switches on or off means line / changes the background color of negative price deviation area/changes mean line width;
3 - Dash custom / defined: when checkbox selected dashing line frequency settings appear (min - 0, max - 50), when the checkbox unselected, predefined line selection option appears.
4 - Extend Left/Right: extend lines to the left and right directions, to the end of visible area;
5 - STDDEV channel - hides standard deviation lines, only mean line is visible;
6 - Source: defines the source of data for linear regression calculation:
POC - candle point of control defined as a source;
VAL - candle values are low defined as a source;
VAH - candle value area high defined as a source;
VALVAH/2 - the sum of the VAL and VAH divided by two defined as a source;
Open - candle open price defined as a source;
High - candle high price defined as a source;
Low - candle low price defined as a source;
Close - candle close price defined as a source;
OC/2 - the sum of the candle open and close divided by two defined as a source;
HL/2 - the sum of the candle high and low divided by two defined as a source;
OHCL/4 - sumo of the candle open, high, close, and low divided by four defined as a source;
7 - Lock - locks LinReg indicator on the chart
Bottom panel:
8 - Save: saves changes under present preset;
9 - Save New: duplicates preset and saves changes as a new preset;
10 - Set Default: sets as default preset, every Linear Regression will be loaded under this preset;
11 - Reset: resets preset to default values;
12 - Remove: deletes preset unrecoverably.