Rectangle settings
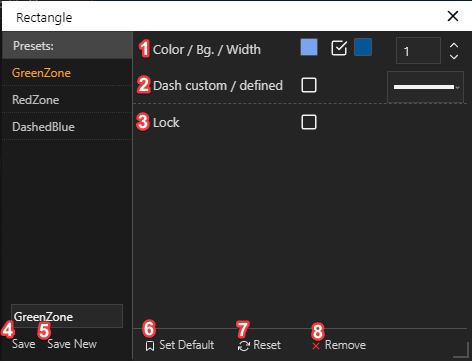
The rectangle tool draws the rectangle on the chart. The tool is commonly used to select specific chart areas. Rectangle tool has 3 prebuilt presets: green zone, red zone dashed blue.

1 - Color / Bg. / Width: changes line color / enables background color and changes background color / sets border line width, min - 1, max - 20;
2 - Dash custom / defined: changes line setting. When the checkbox is selected, dashing line frequency settings appear (min - 0, max - 50), when the checkbox is unselected, a predefined line selection option appears;
3 - Lock: locks rectangle on the chart;
Bottom panel:
4 - Save: saves changes under present preset;
5 - Save New: duplicates preset and saves changes as a new preset;
6 - Set Default: sets as default preset, every new rectangle will be loaded under this preset;
7 - Reset: resets preset to default values;
8 - Remove: deletes preset unrecoverably.