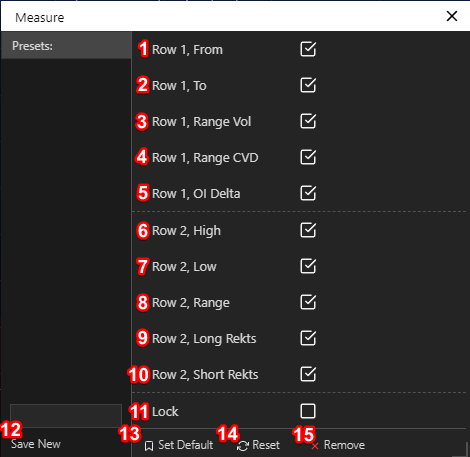
Measure tool settings
The Measure tool provides additional information about the market from the selected on-screen chart range. Candles data summary is displayed at the bottom of the selected area range. The tool displays volume, CVD, OI, candle High and Low, selected range price delta, and REKT's. Measure tool does not have integrated any presets, but the user could create their own presets.
Measure tools have two different drawing options, bottom to top and top to bottom. By drawing from bottom to top the area will be shaded in blue color and the summary information background will be a blue color. By drawing from top to bottom the area will be shaded in red color and the summary information background will be red color.

1 - Row 1, From: displays selected range beginning date and time;
2 - Row 1, To: displays selected range the end date and time;
3 - Row 1, Range Vol.: displays selected range total volume;
4 - Row 1, Range CVD: displays CVD over the selected period;
5 - Row 1, OI Delta: displays OI delta over the selected period;
6 - Row 2, High: displays highest price value reached by the candle in the selected range;
7 - Row 2, Low: displays lowest price value reached by the candle in the selected range;
8 - Row 2, Range: displays price delta (numeric value and percentage expression) over the selected range;
9 - Row 2, Long Rekts: displays sum of Long's liquidations (LRekt) from the selected range;
10 - Row 2, Short Rekts: displays sum of Short's liquidations (SRekt) from the selected range;
11 - Lock: locks Measure tool position on the chart;
Bottom panel:
12 - Save New: duplicates preset and saves changes as a new preset;
13 - Set Default: sets as default preset, every new Measure tool will be loaded under this preset;
14 - Reset: resets preset to default values;
15 - Remove: deletes preset unrecoverably.